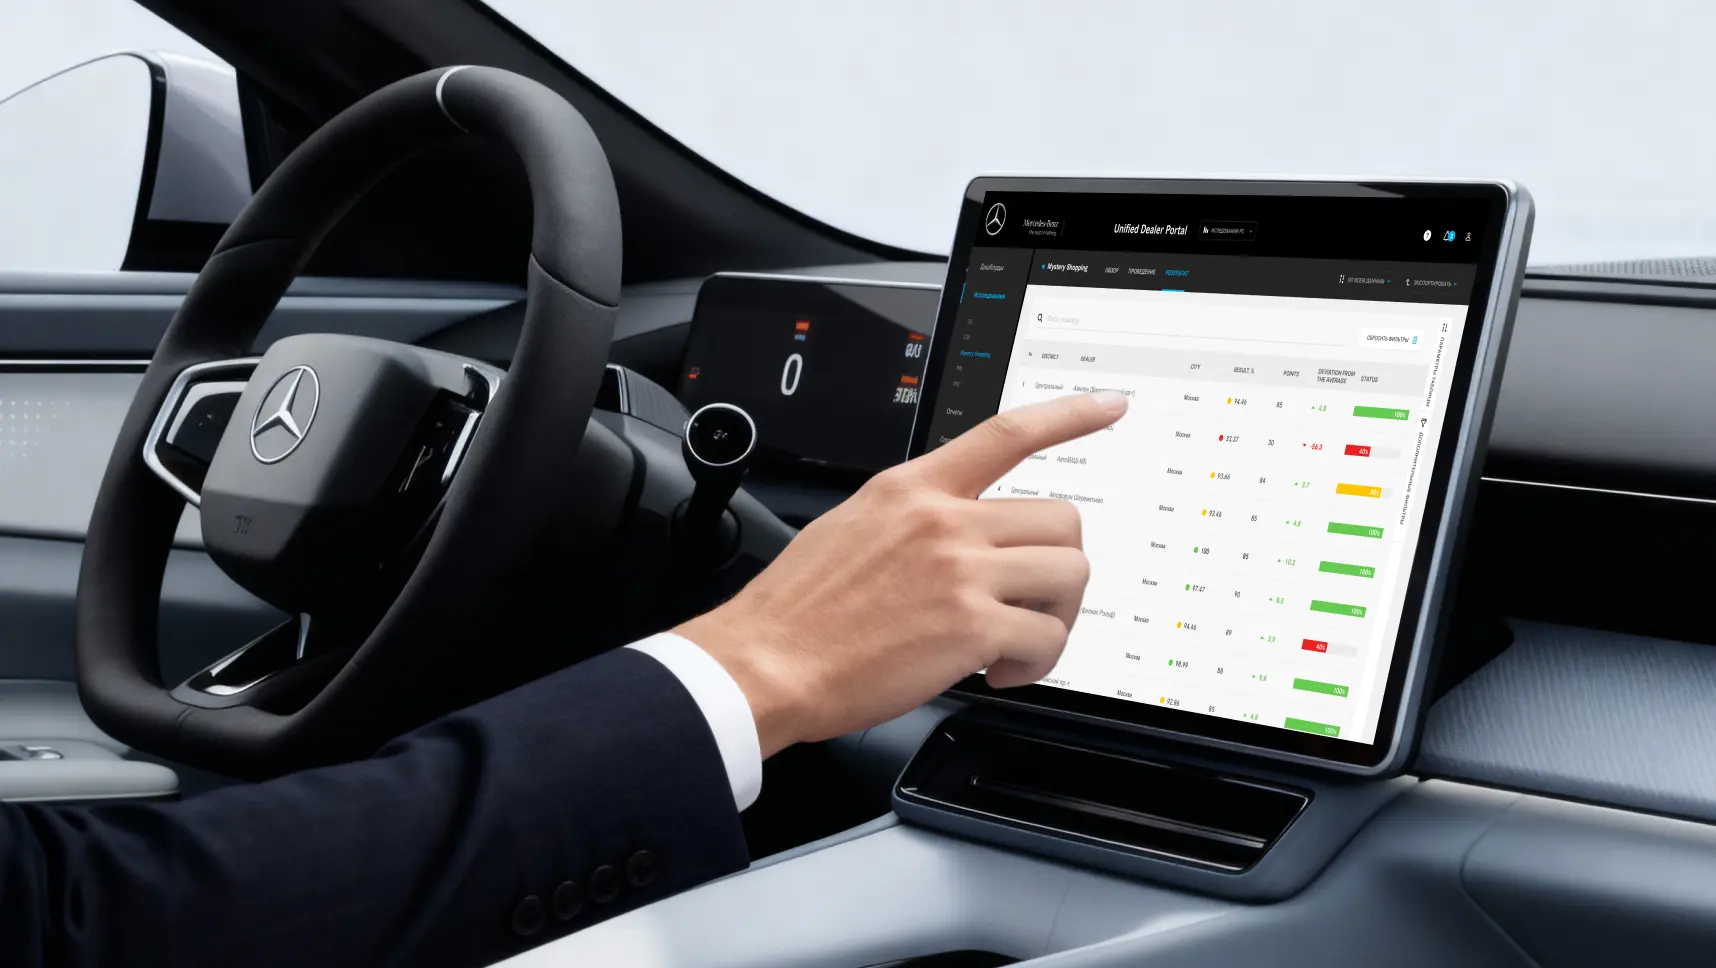
Dealer Quality Analytics Platform for Mercedes-Benz
We built for Mercedes-Benz an analytics platform that unifies dealer-quality surveys and KPI reporting, replacing Excel bases.

Client & Context
The task was to create an internal system for dealer employees and Mercedes-Benz to conduct quality surveys and analyze results — reducing the number of internal/external IT systems and independent Excel databases used with dealer KPIs.
Goals
- 1Standardize how results are collected, visualized, and compared over time.
- 2Provide fast, intuitive dashboards for regions and individual dealers.
- 3Ensure single sign-on with corporate identity and consistent UI components.
Challenges
Designing for Clarity, Speed, and Scale
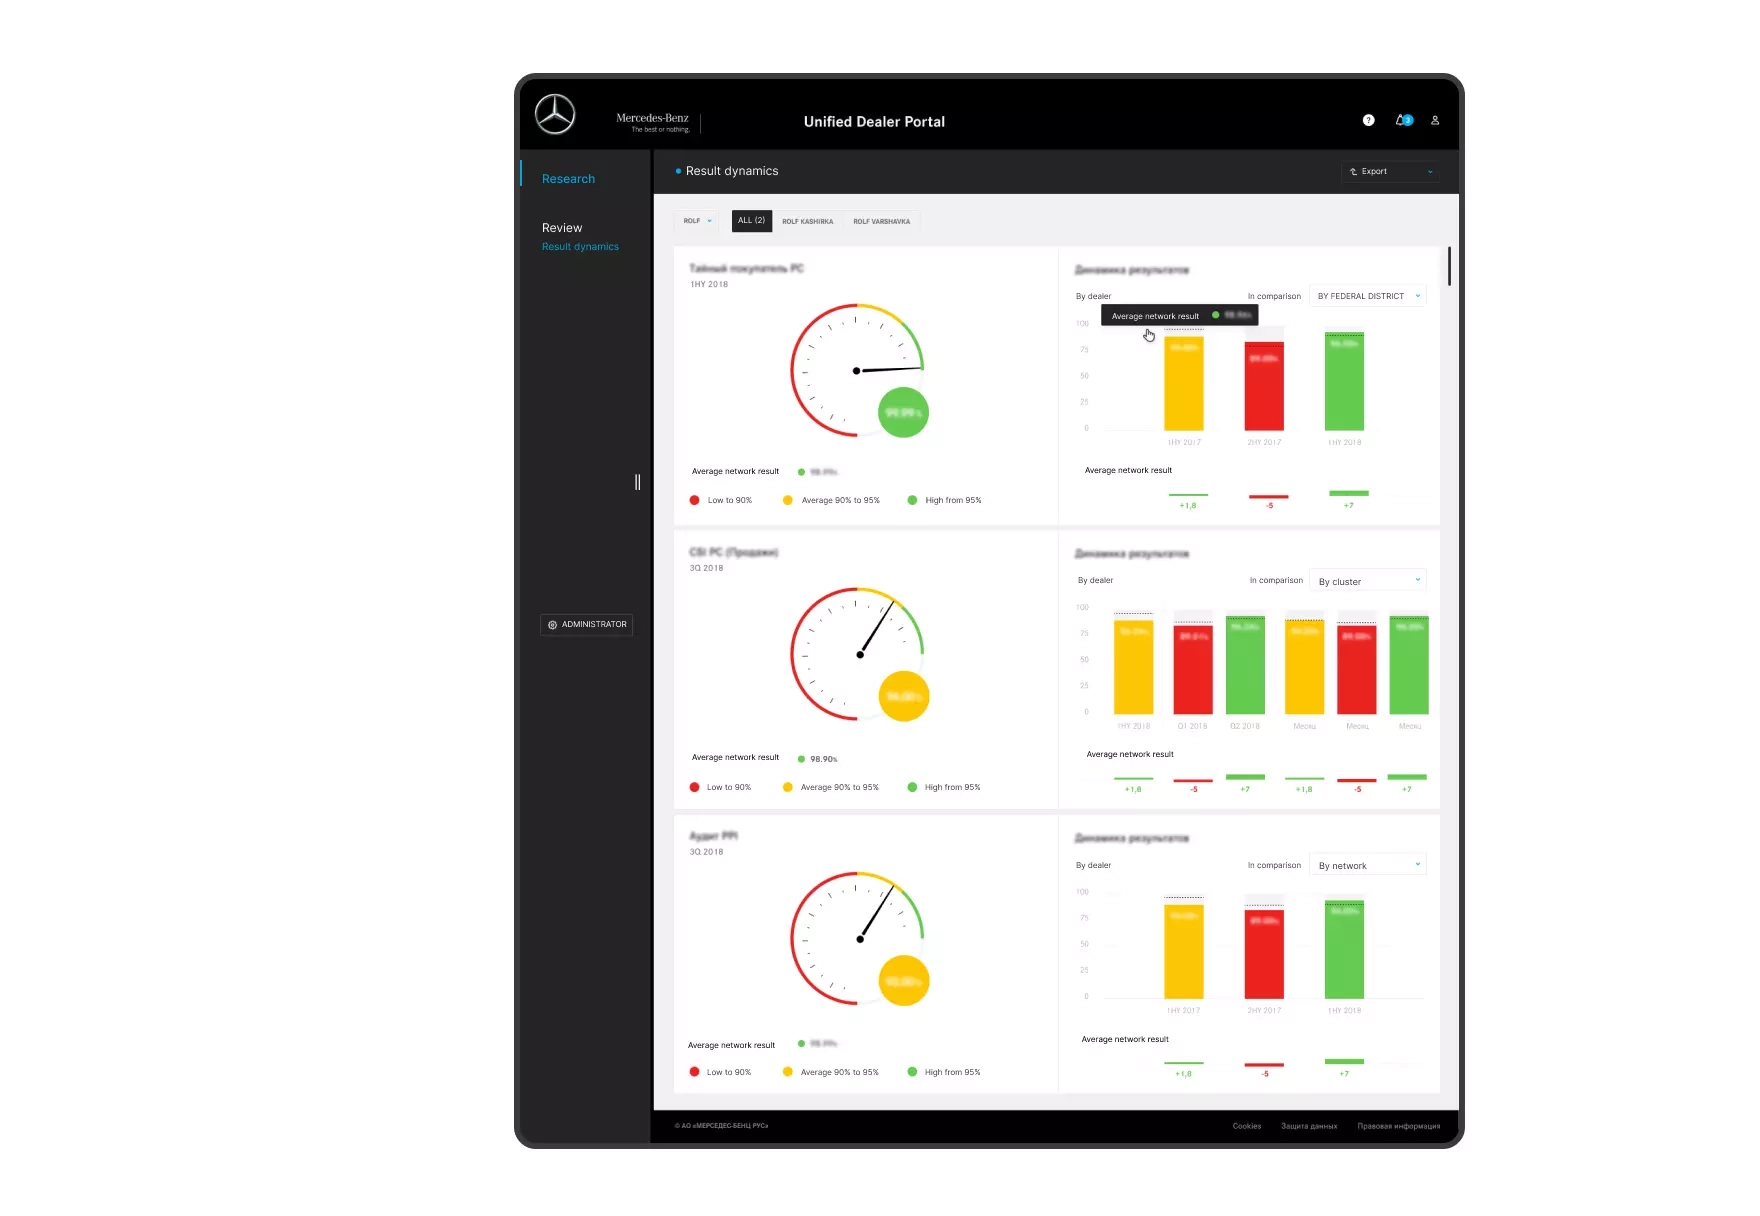
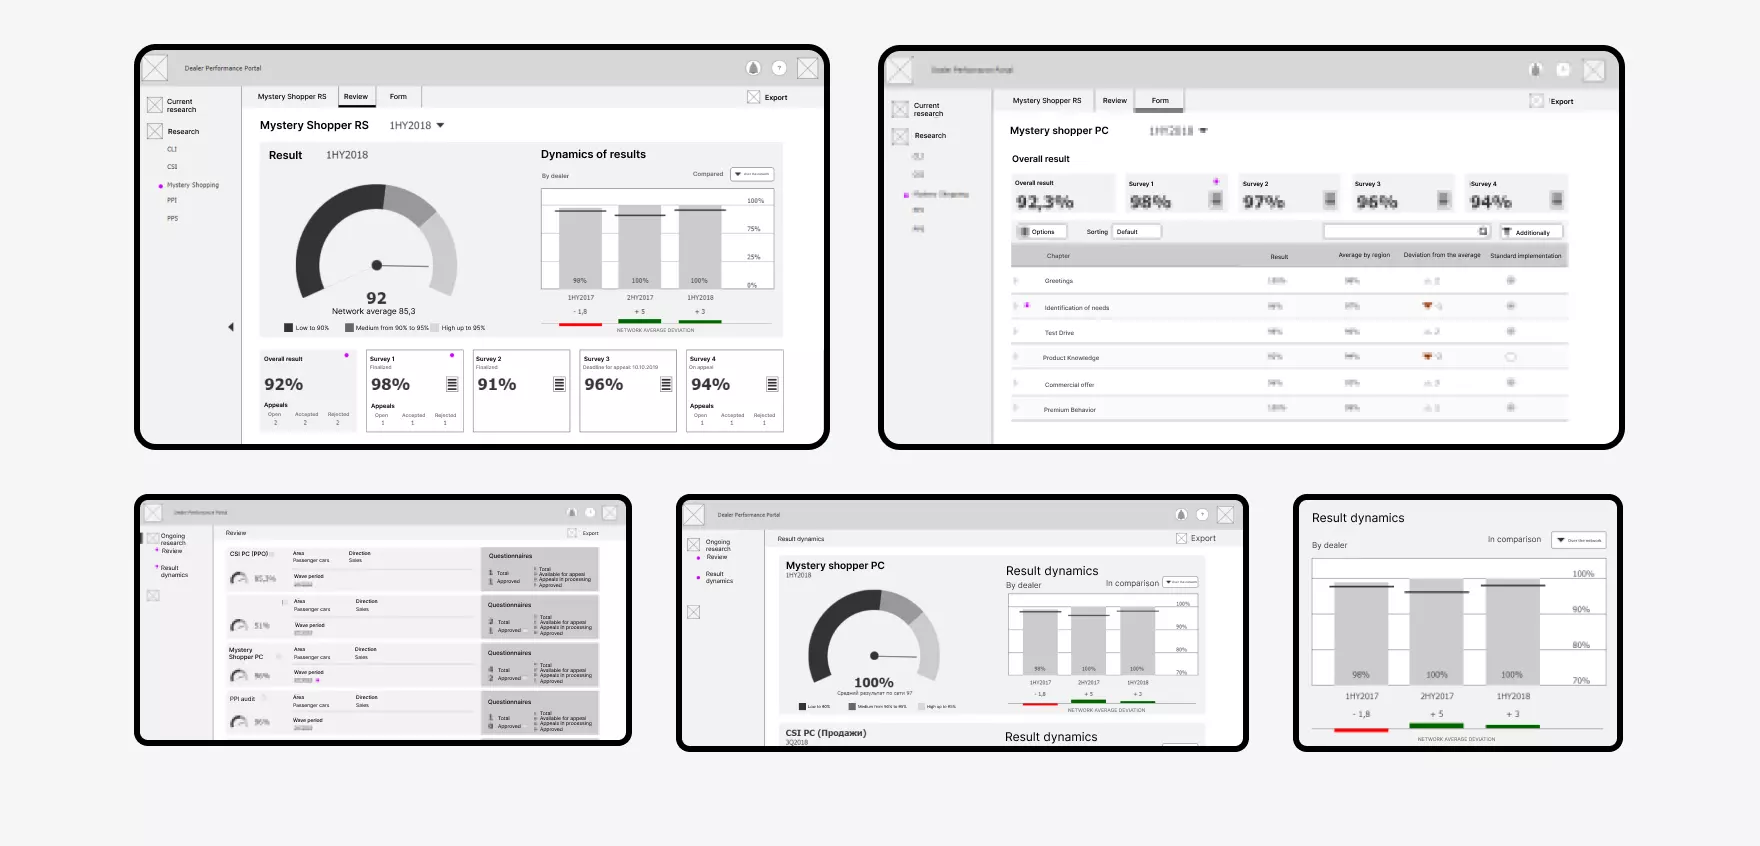
Visualization
We respected Mercedes-Benz guidelines and unified charts using react ag-Grid, FusionCharts, and FusionMaps — speeding frontend delivery and keeping visuals consistent.
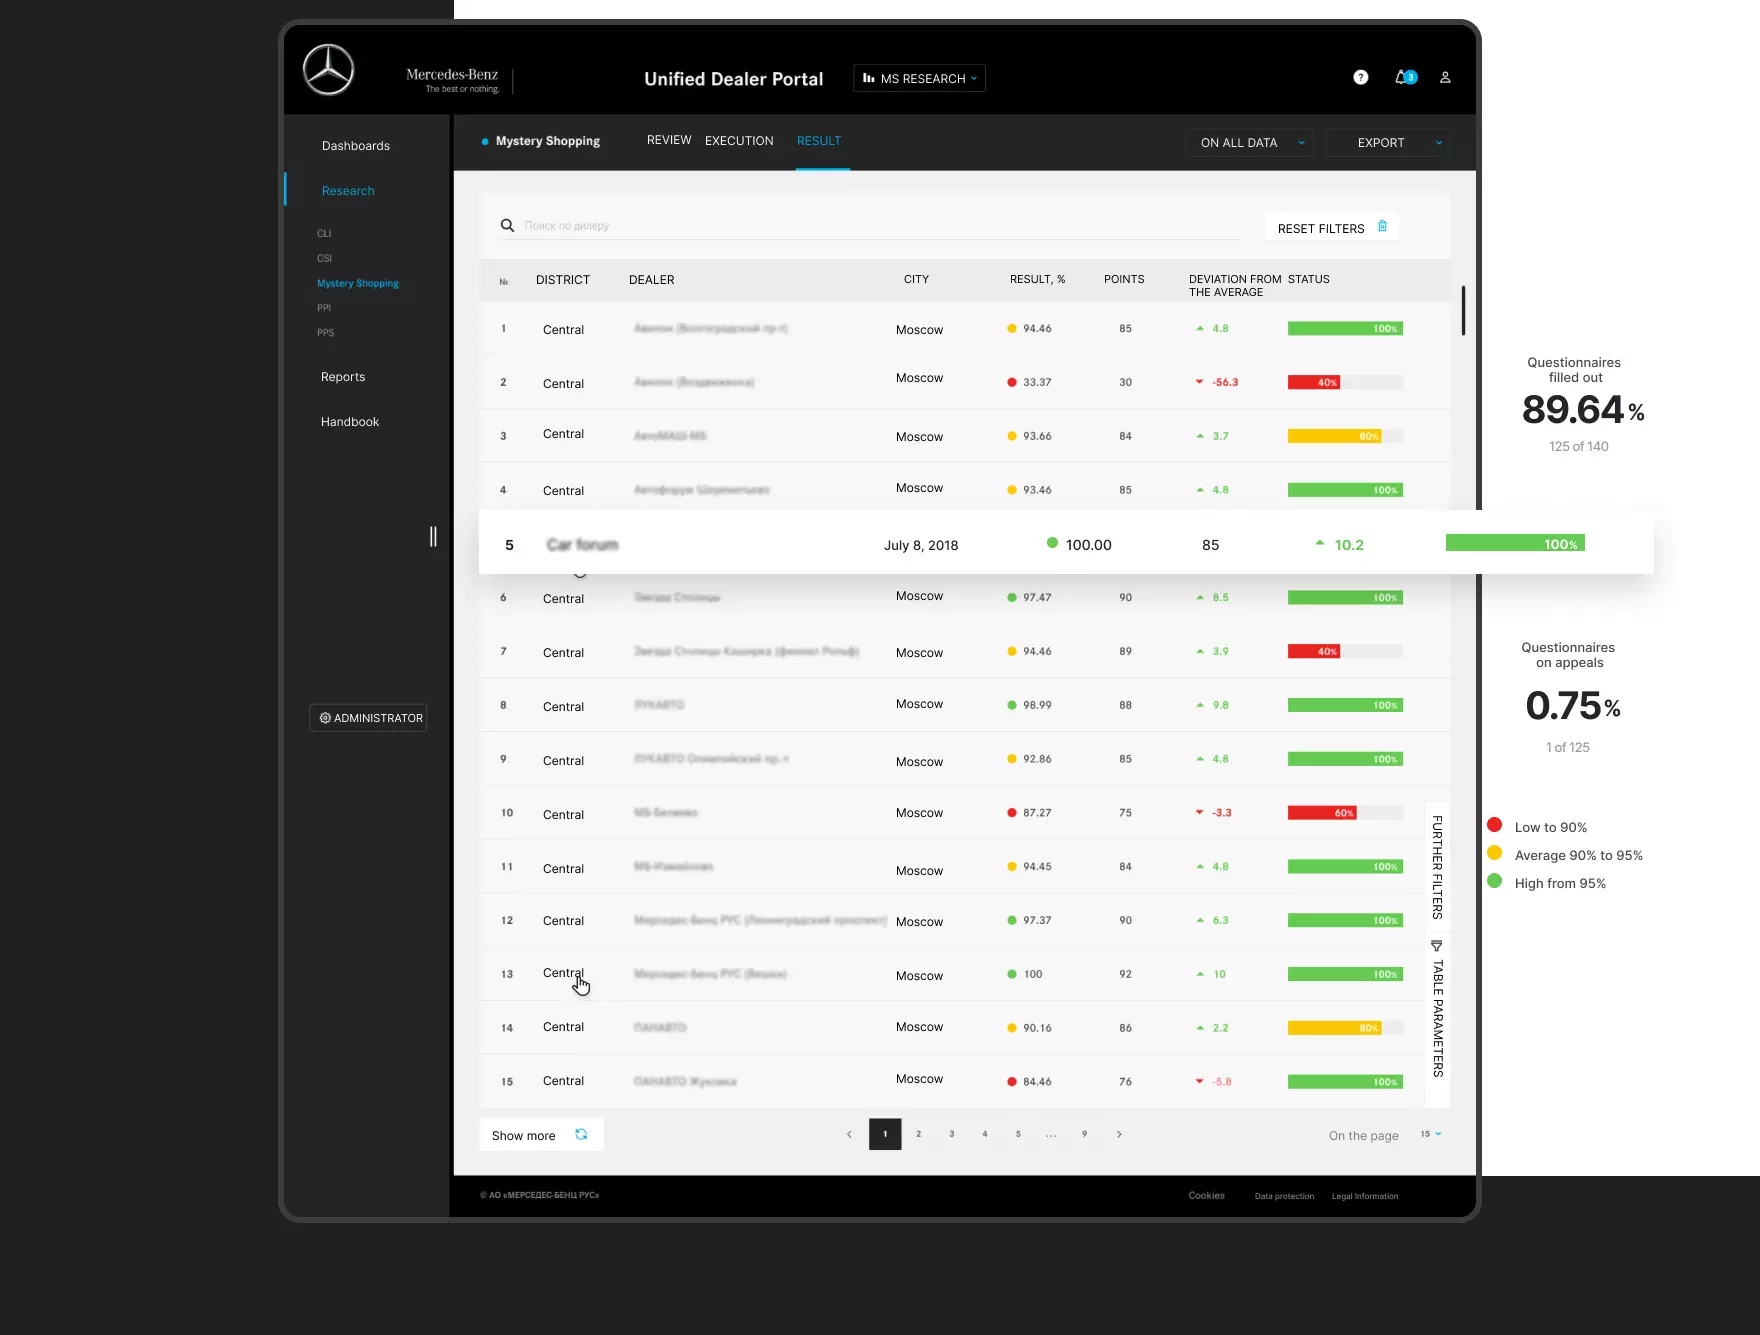
Results with Dealers and District filtres
Dashboards
A tabular view tracks results by city, country, and dealer; the UI highlights trend dynamics to help managers act quickly at each dealer center.
Results by category
Histogram of dealer results
A ranked histogram shows the distribution of scores by dealer — making it easy to spot excellent/average/weak performers.
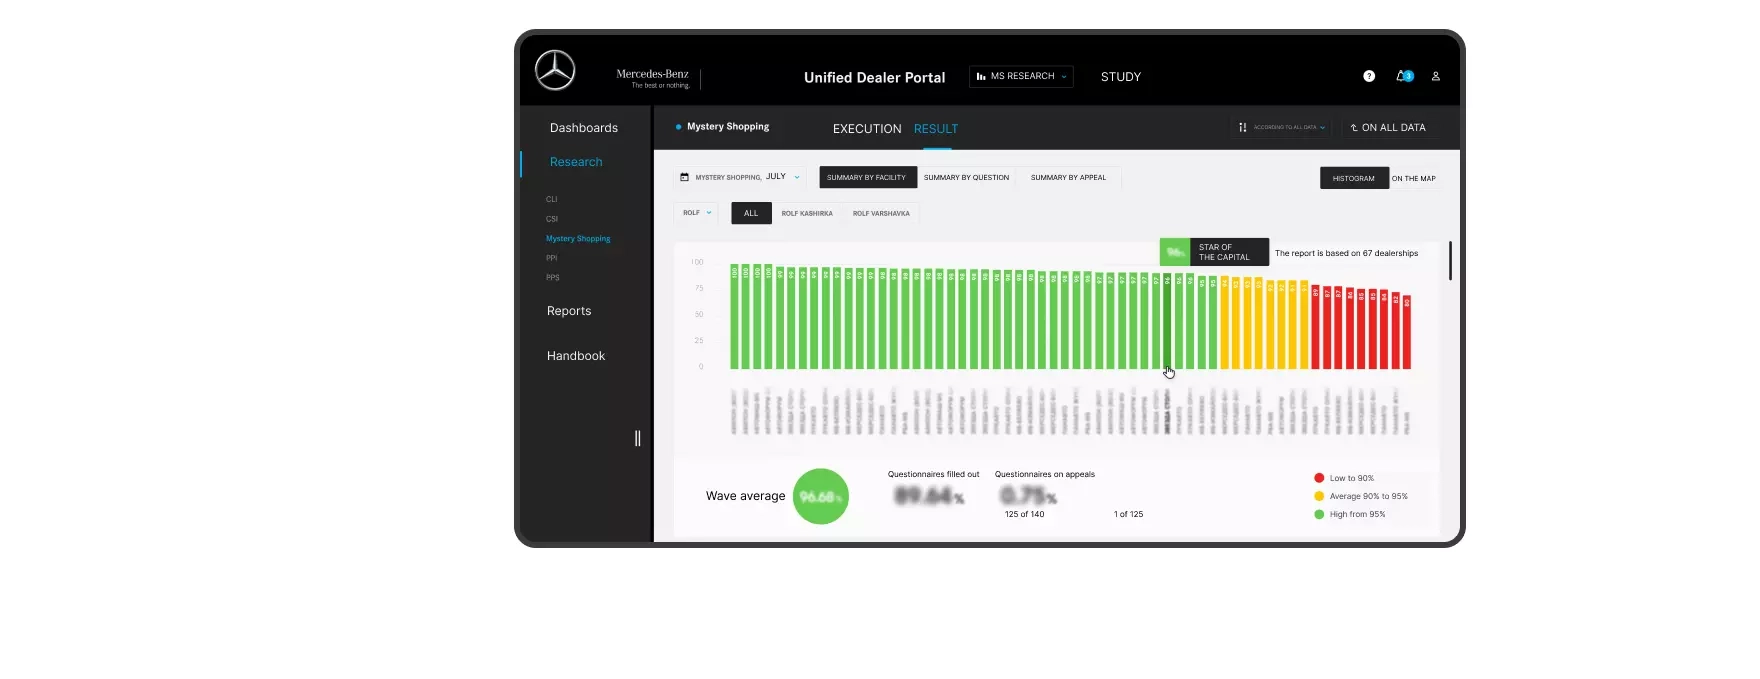
Histogram of dealer results
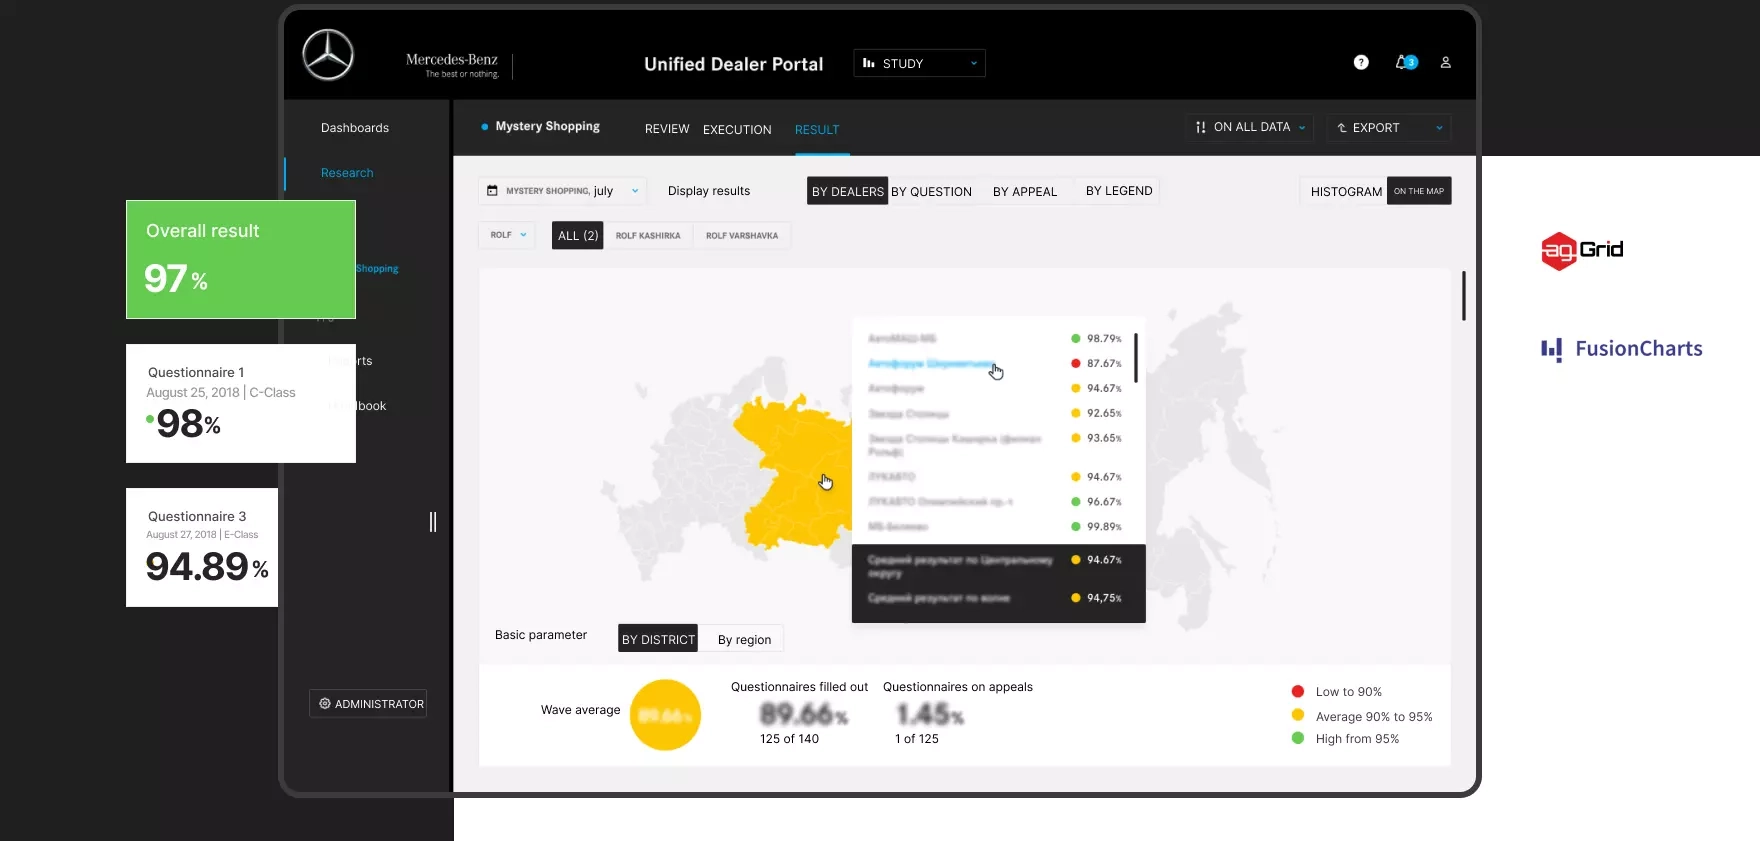
Period comparison
A pie + bars view compares current and previous periods, revealing trend shifts that drive corrective actions.
Period comparison
Per-dealer
For a chosen study and dealer, the platform shows result dynamics and a questionnaire table to analyze specifics.
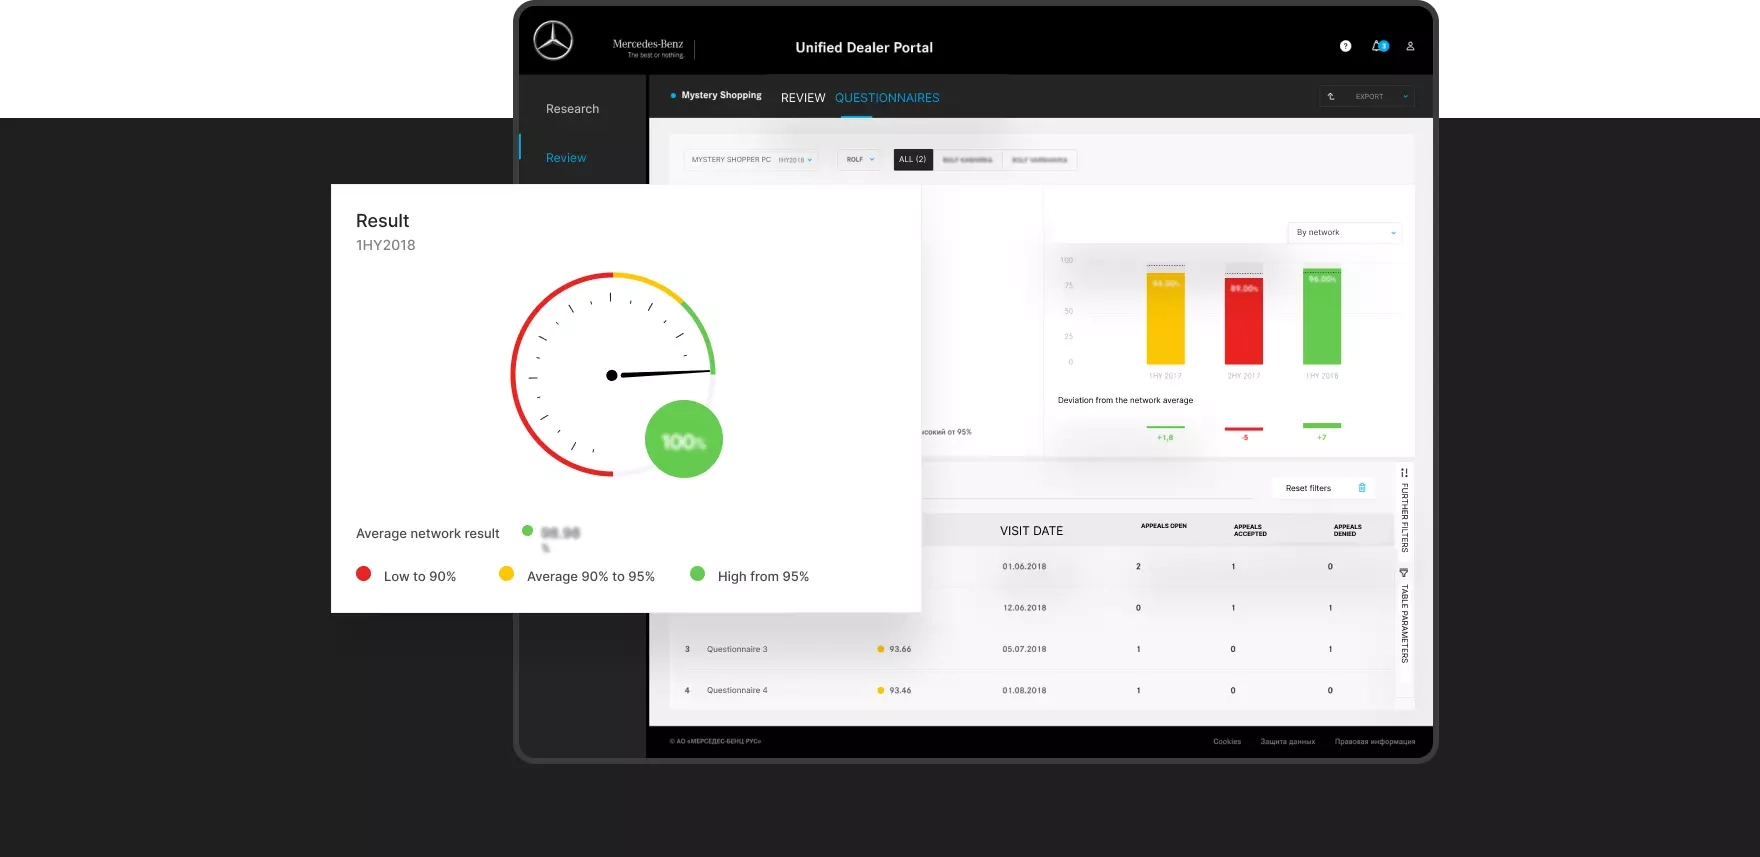
Result per-dealer
Mobile version
Adaptive layouts make core widgets usable on smartphones for field managers.
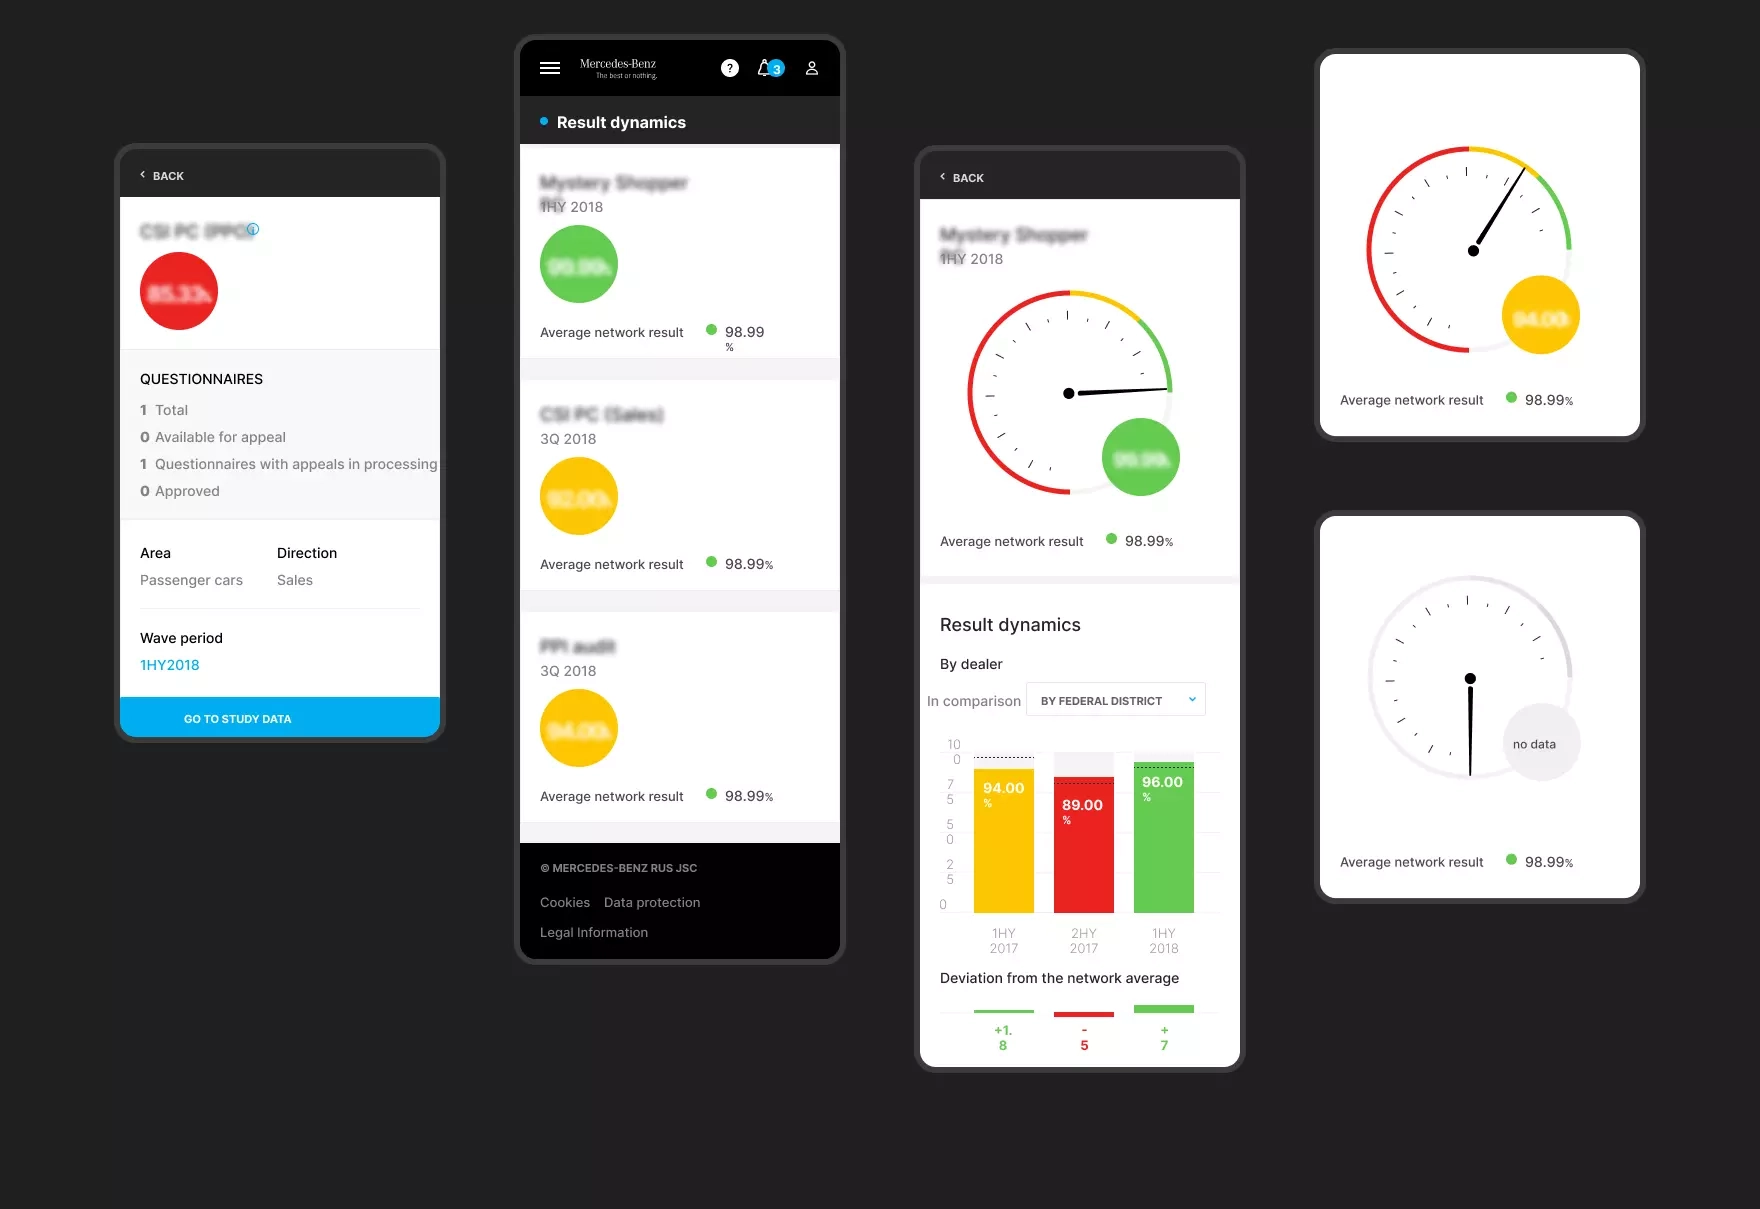
Mobile version for Results
SSO & corporate login
We integrated with the internal OpenID-based authorization system so users sign in once across corporate resources.
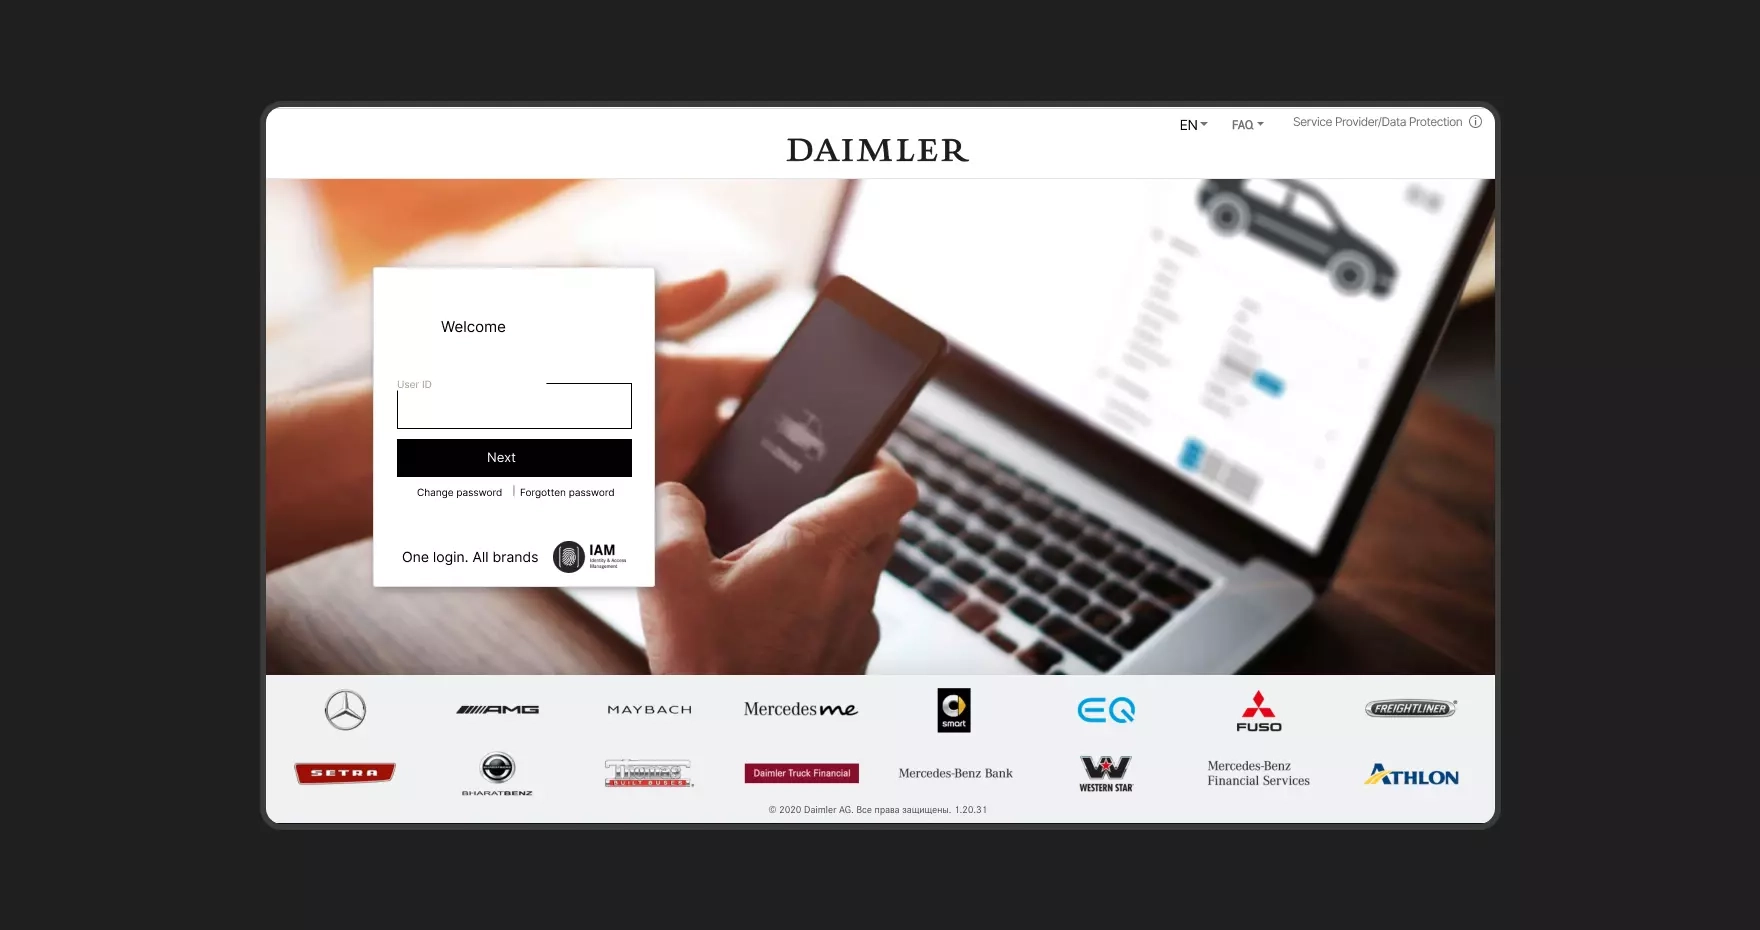
Authorization screen
Uniform documentation
Together with the client, we introduced a single documentation format to speed business input and ongoing change management.
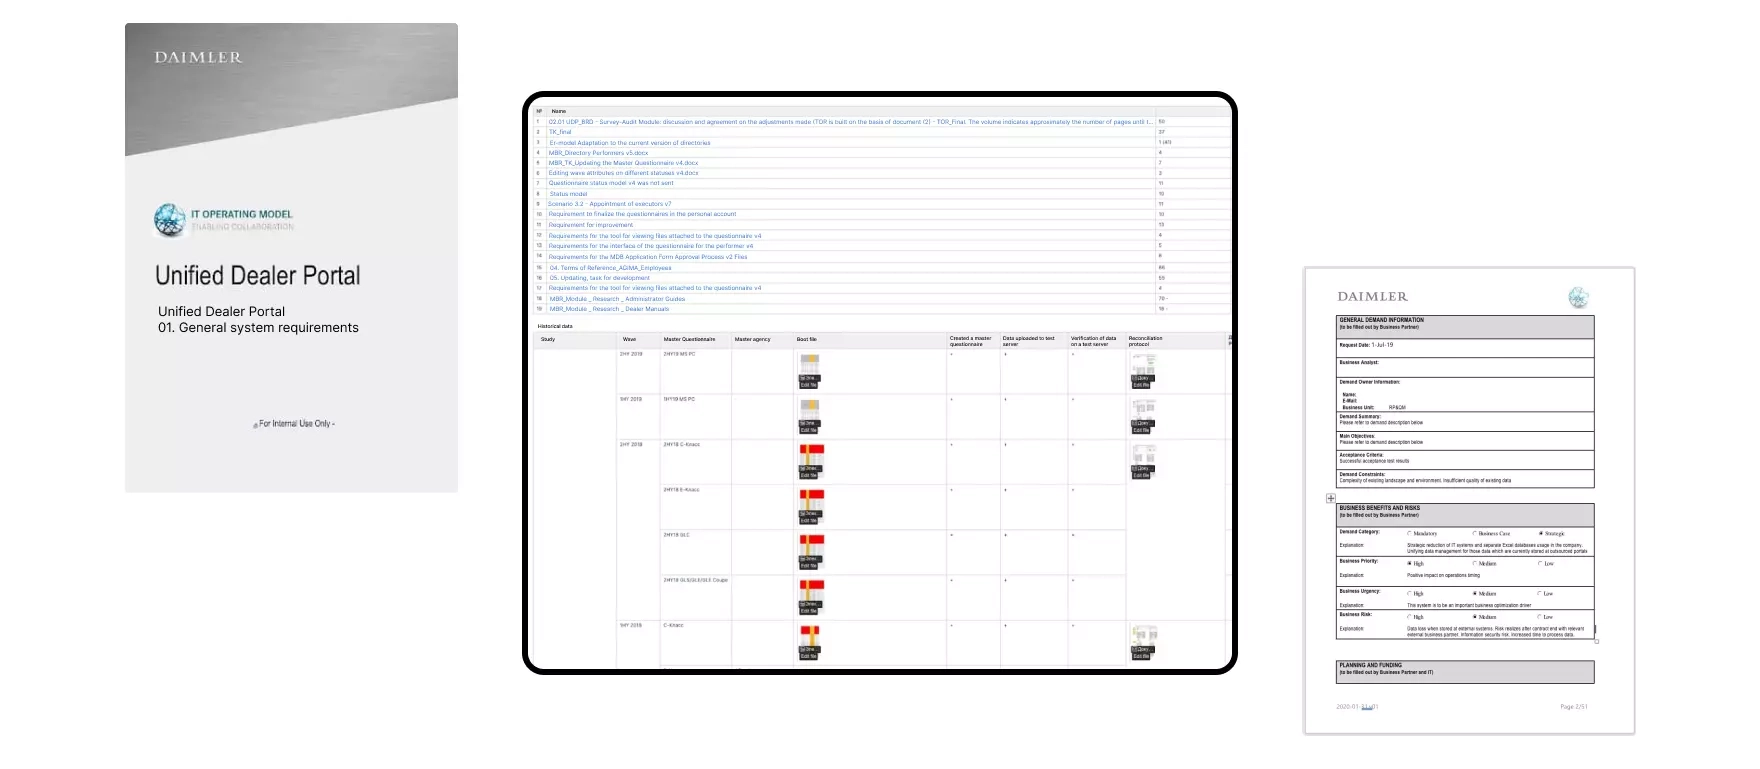
A single documentation format
Prototyping & research
We interviewed dealer reps, shared clickable prototypes with multiple interface states, and iterated to support expansion and growth.
Clickable prototypes with multiple interface states
Technology choice
We selected GraphQL to flexibly serve diverse UIs/consumers; despite the extra effort under Windows/IIS with MS SQL, it paid off in convenience and scalability.
Risks & How We Mitigated Them
Missing the deadline
Mitigation. We fixed a short, weekly milestone rhythm and only moved forward after each milestone was approved.
Design/dev blocks while waiting for feedback
Mitigation. We booked fixed review windows.
A key designer or developer becomes unavailable
Mitigation. We kept specs and demo recordings up to date and assigned a backup owner for each critical area.
Compliance & Security
Results
One platform now consolidates dealer-quality surveys and analytics for Mercedes-Benz. Managers get clearer, faster dashboards (region → dealer → questionnaire) with consistent visuals and SSO, and field teams can review key widgets on mobile — reducing effort and improving decision speed.